
Five days ago, I wrote a blog post about the unusually strong nearly periodic oscillations in the global temperature anomalies measured by satellites. The periodicity seems to be 44-45 months or 3.7 years or so.

Your humble correspondent, Bill Zajc, and Roy Spencer have done various interesting calculations. For example, Roy Spencer told me about his calculation saying that my alternative mundane explanation rooted in the leap years cycle gives a 4-year periodicity and 10+ times smaller amplitude than what is needed.
Here, I want to make a comment inspired by the possibility that the periodicity in the terrestrial temperatures is linked to the solar cycles. Does it work well? And what is the relative phase?
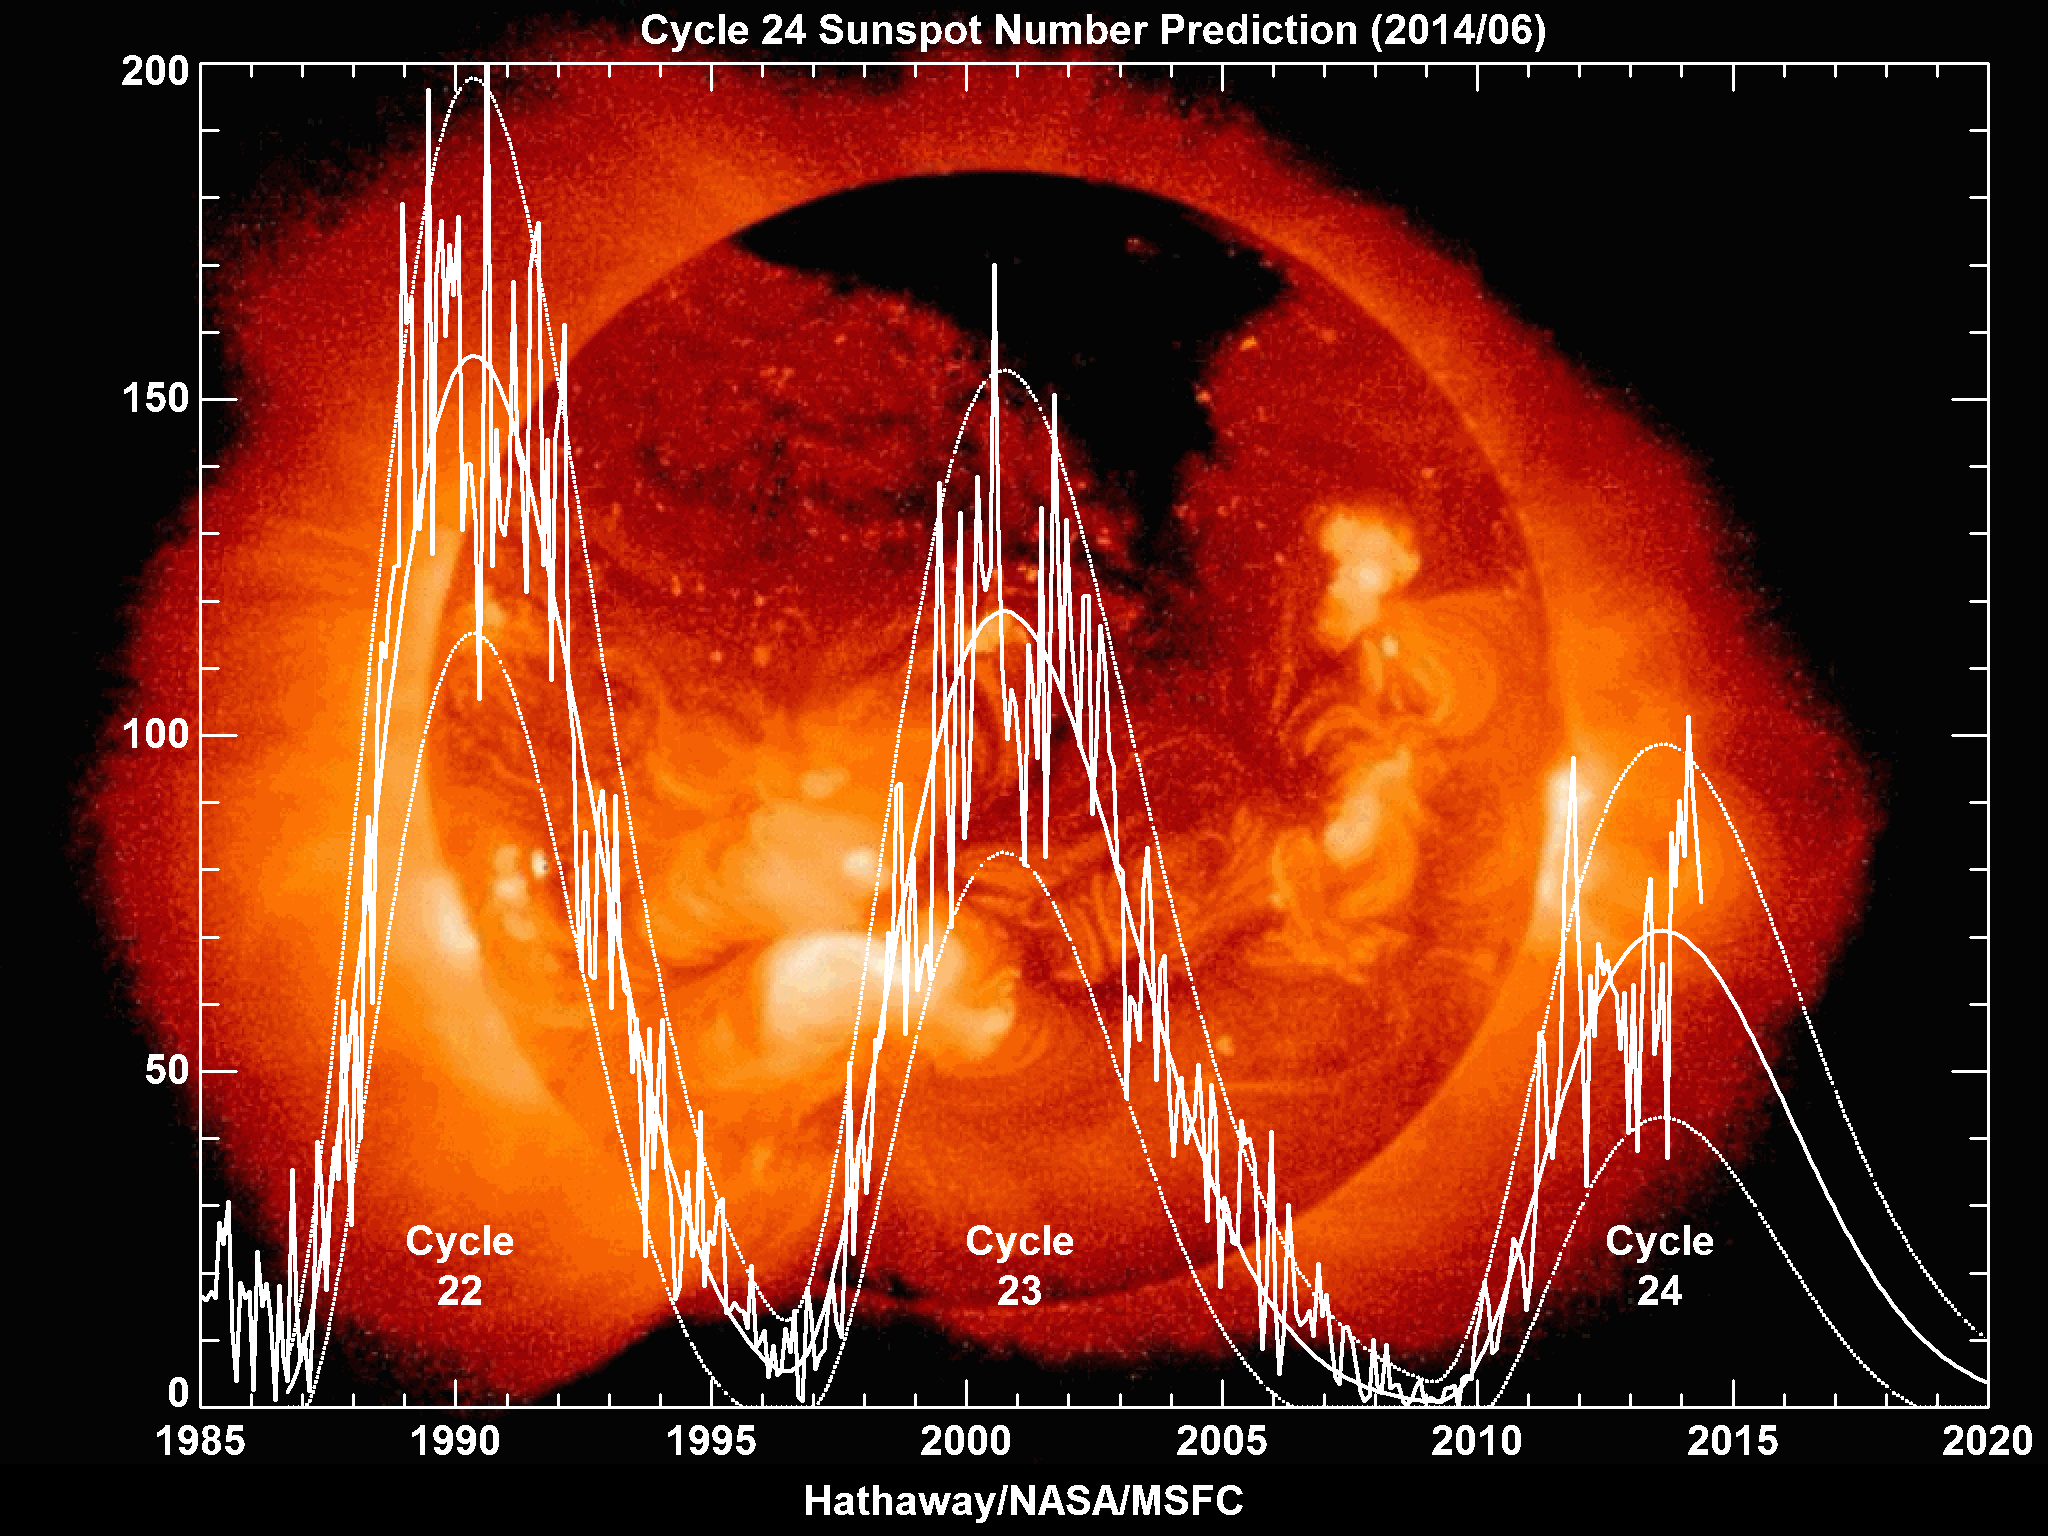
To get some answers, I entered the months when some recent solar cycles began.
My convention to identify the month YYYY/MM is YYYY*12+M. So the list of the beginnings/ends of the solar cycles is
This more precise fitting of the cycles gives us a pretty much identically good fit as the "constant periodicity" fits. To try the latter (which only "modestly" differs from the real-world variable-length solar cycles), write
In the case of phase3, it is not necessarily a coincidence that the correlation with the cosine is much larger than the correlation with the sine. You may view it this fact as evidence in favor of the solar explanation of the 45-month cycles.
I want to make you sure that we're still talking about 0.12 °C times the cosine. Using the command LinearModelFit, we may calculate
At those points where it drops, the cosine is equal to +1, and –0.12 °C times the cosine is therefore minimized.
The main result of the calculation is that it seems compatible with the data to explain the strong 45-month oscillation by thirds of the solar cycles. If we do so, the coolest moments are expected to be the beginning of each cycle, 1/3 of the solar cycle after the beginning, and 1/3 of the solar cycle before the end. The middle of each cycle, much like 1/6 after the beginning and 1/6 before the end, would be the warmest moments of each cycle.
Again, I have no idea why the Sun would highlight the third harmonic in this way if the basic 11-year periodicity is pretty much invisible in the climate data.
This is one of the videos about the 2012 coronal triangular hole inside the Sun observer by NASA in 2012. The video also refers to the oldest Jewish shrine with a triangle inside the Sun, with a JHVH caption. ;-) Some of these links may be coincidences, some of them are jokes, but it's plausible that a triangular structure inside the Sun explains the importance of the third harmonic.
I have also tried to compare the solar cycles since 1850 with the HadCRUT4 dataset since January 1850. The correlation with the cosine is nearly zero. It has the wrong sign (opposite than above, positive), the correlation is 0.058 instead of 0.38, and the linear model fit slope (amplitude) is just 0.02 °C instead of 0.12 °C. So it doesn't work with this long weather station record.
Maybe the satellite observations are just perturbed by the solar magnetic or geomagnetic effects through some phenomena in the upper layers of the atmosphere that are not terribly important for the near-surface weather. Maybe they see something that is important for the weather and the weather station record doesn't see it because it's lousy.
Vorontsov et al. 2002 talk about the third harmonic of the solar cycle but it's behind the paywall. Basu and Antia's similar paper from 2003 (800+ citations!) seems to be available (see page 557). Some papers by Howe and Christensen-Dalsgaard may also be relevant.
Your humble correspondent, Bill Zajc, and Roy Spencer have done various interesting calculations. For example, Roy Spencer told me about his calculation saying that my alternative mundane explanation rooted in the leap years cycle gives a 4-year periodicity and 10+ times smaller amplitude than what is needed.
Here, I want to make a comment inspired by the possibility that the periodicity in the terrestrial temperatures is linked to the solar cycles. Does it work well? And what is the relative phase?
To get some answers, I entered the months when some recent solar cycles began.
My convention to identify the month YYYY/MM is YYYY*12+M. So the list of the beginnings/ends of the solar cycles is
newcycles = {1976*12 + 5, 1986*12 + 3, 1996*12 + 6, 2008*12 + 1, 2020*12 + 1}which should be entered into Mathematica. I somewhat speculatively added January 2020 because the ongoing Solar Cycle 24 is likely to be weaker, and therefore longer – the estimate above is 12 years. Now I defined functions that measure what fraction of the ongoing cycle has passed on a given month:
sincenewcycle[month_] := Min[DeleteCases[(month - newcycles)*(1 + Sign[month - newcycles])/2, 0]]The final function, phase[month], gives you the number between 0 and 1 that is linearly increasing and drops from 1 to 0 when a new cycle begins. Try
tonewcycle[month_] := -Max[
DeleteCases[(month - 1 -
newcycles)*(1 - Sign[month - 1 - newcycles])/2, 0]]
currentCycleLength[month_] := sincenewcycle[month] + tonewcycle[month]
phase[month_] := sincenewcycle[month]/currentCycleLength[month]
ListLinePlot[Table[phase[i], {i, 1978*12 + 12, 2015*12 + 3}]]We may also define the "three times faster" cycles that are nevertheless squeezed to the usual solar cycles:
phase3[month_] := FractionalPart[3.*phase[month]]Let's import the 436 monthly readings of UAH AMSU:
ListLinePlot[Table[phase3[i], {i, 1978*12 + 12, 2015*12 + 3}]]
a = Import[Yes, the output is 436. Our cool result is the correlation coefficient:
"http://vortex.nsstc.uah.edu/data/msu/v6.0beta/tlt/uahncdc_lt_6.0beta1.txt", "Table"];
a = a[[2 ;; -13]];
b = a[[All, 3]]; Length[b]
Correlation[b,The results are –0.383 and +0.066, respectively. The correlation with the cosine of phase3 (times two pi) is negative, much larger than the correlation with the sine of phase3 (times two pi), and almost 0.4. I think it is a very high correlation coefficient.
Table[Cos[phase3[i]*2*Pi], {i, 1978*12 + 12, 2015*12 + 3}]]
Correlation[b,
Table[Sin[phase3[i]*2*Pi], {i, 1978*12 + 12, 2015*12 + 3}]]
This more precise fitting of the cycles gives us a pretty much identically good fit as the "constant periodicity" fits. To try the latter (which only "modestly" differs from the real-world variable-length solar cycles), write
Correlation[b, Table[Cos[i/45*2*Pi], {i, 1978*12 + 12, 2015*12 + 3}]]and the results are 0.394 and 0.068 – almost identical as the correlations computed from phase3. It is a coincidence (a random factoid about the phase shifts and my convention for the calendar) that the phase shift above makes the correlation with the cosine much (5.5 times) larger than the correlation with the sine.
Correlation[b, Table[Sin[i/45*2*Pi], {i, 1978*12 + 12, 2015*12 + 3}]]
In the case of phase3, it is not necessarily a coincidence that the correlation with the cosine is much larger than the correlation with the sine. You may view it this fact as evidence in favor of the solar explanation of the 45-month cycles.
I want to make you sure that we're still talking about 0.12 °C times the cosine. Using the command LinearModelFit, we may calculate
Normal[LinearModelFit[The result is
Transpose[{Table[
Cos[phase3[i]*2*Pi], {i, 1978*12 + 12, 2015*12 + 3}],
b}], cosine, cosine]]
–0.017 – 0.116 * cosineAgain, the temperature anomaly behaves as –0.12 °C times the cosine of phase3 (times two pi) where phase3 is the function between 0 and 1 that linearly increases almost everywhere and drops from 1 to 0 three times during each cycle, including the beginning/end of each cycle.
At those points where it drops, the cosine is equal to +1, and –0.12 °C times the cosine is therefore minimized.
The main result of the calculation is that it seems compatible with the data to explain the strong 45-month oscillation by thirds of the solar cycles. If we do so, the coolest moments are expected to be the beginning of each cycle, 1/3 of the solar cycle after the beginning, and 1/3 of the solar cycle before the end. The middle of each cycle, much like 1/6 after the beginning and 1/6 before the end, would be the warmest moments of each cycle.
Again, I have no idea why the Sun would highlight the third harmonic in this way if the basic 11-year periodicity is pretty much invisible in the climate data.
This is one of the videos about the 2012 coronal triangular hole inside the Sun observer by NASA in 2012. The video also refers to the oldest Jewish shrine with a triangle inside the Sun, with a JHVH caption. ;-) Some of these links may be coincidences, some of them are jokes, but it's plausible that a triangular structure inside the Sun explains the importance of the third harmonic.
I have also tried to compare the solar cycles since 1850 with the HadCRUT4 dataset since January 1850. The correlation with the cosine is nearly zero. It has the wrong sign (opposite than above, positive), the correlation is 0.058 instead of 0.38, and the linear model fit slope (amplitude) is just 0.02 °C instead of 0.12 °C. So it doesn't work with this long weather station record.
Maybe the satellite observations are just perturbed by the solar magnetic or geomagnetic effects through some phenomena in the upper layers of the atmosphere that are not terribly important for the near-surface weather. Maybe they see something that is important for the weather and the weather station record doesn't see it because it's lousy.
Vorontsov et al. 2002 talk about the third harmonic of the solar cycle but it's behind the paywall. Basu and Antia's similar paper from 2003 (800+ citations!) seems to be available (see page 557). Some papers by Howe and Christensen-Dalsgaard may also be relevant.
Solar cycles and 45-month oscillations of temperature
 Reviewed by DAL
on
May 04, 2015
Rating:
Reviewed by DAL
on
May 04, 2015
Rating:
Reviewed by DAL
on
May 04, 2015
Rating:


No comments: