
João Magalhães sent me a link to an article by John O’Sullivan at ClimateGate.com about the research by Chiefio aka E.M. Smith and his Czech reader Jan (meaning "John").

Prague's Clementinum, an old Jesuit Convent and the current National and University Library near the Charles Bridge (Google Maps), hosts the world's second oldest continuously working weather station after the Central England dataset (*1659) and, obviously, the oldest one in the Czech Republic. The records go back to 1770 and haven't been interrupted or modified since 1775.
The picture of the building above is not too beautiful by itself but you can take prettier pictures of the Old Town from the Clementinum tower. ;-)
Today, Clementinum is also the warmest weather station in the Czech Republic, exceeding the annual mean temperature of 10 °C, arguably because of urban effects as well as its low elevation of 192 meters. The coldest station in Czechia is on our highest peak Sněžka, elevation 1602 meters, on the Czech-Polish border. Its annual mean temperature is close to the freezing point. The Czech average is around 7 °C.

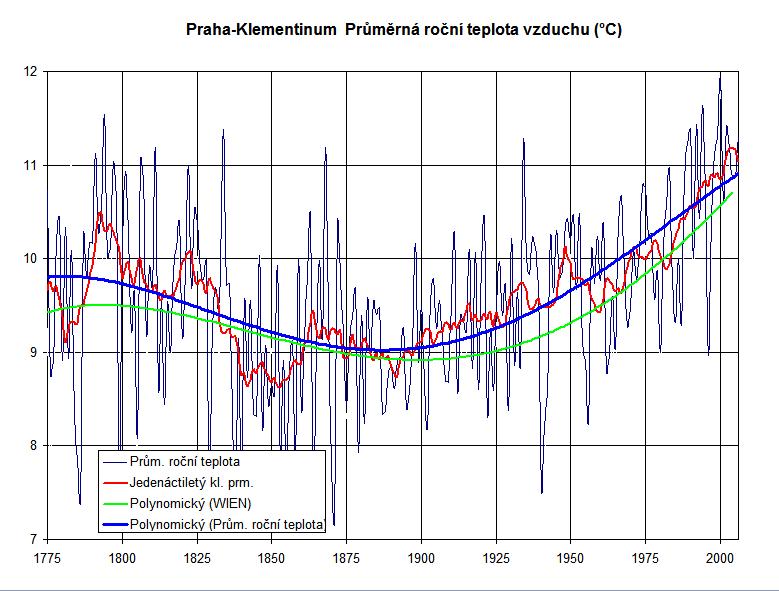
Click to zoom in or get the Excel file or CSV file (with proper English decimal points, not comma) with the monthly averages since 1770 which began to be recorded during the reign of Maria Theresa of Austria, queen of Bohemia. The Clementinum temperature was mostly cooling between 1800 and 1900 and mostly warming since 1900, by roughly the same amount.
If you allow me to cherry-pick a bit, the Clementinum's annual mean temperature in 1794 was 11.50 °C but 10.88 °C in 2005.

The 1848 revolution in Prague. As recently as in 1850, Prague only had 157,000 inhabitants, which includes the (relatively negligible) villages that joined Prague later - much fewer than the 1.2 million population today. Guess how the urban heat effects have changed since 1800.
The links above present some evidence that this robust old station which, despite the urban effects, shows that there's been no statistically significant warming in Prague since 1800 (and at most 0.5 °C or so in 200 years, and I haven't subtracted any corrections for the intensification of Prague's urban heat island which may be as much as 0.6 °C per century and which would probably revert the 200-year trend to a significant cooling!), has been deliberately censored from the GHCN data in some way, without a known scientific reason, and replaced by some gapped and strangely artificially adjusted data from the Prague International Airport (Ruzyně, a Western suburb of the Czech capital).

The incomplete Prague International Airport data were taken instead of the Clementinum data. Moreover, inside them, a gap in the 1940s was inserted and the temperatures on both sides were "adjusted" to change a cooling trend (blue) to a warming trend (red).
A lot of seemingly problematic stuff to check.
It's plausible that the Clementinum data actually show that there's been no statistically significant warming in all of Central Europe for 200 years.
Warming trends in Prague since 1770
This text is a counterpart of Warming Trends in Central England Since 1659 where I explain the basic issues. The Prague record, the second oldest, is somewhat shorter.
The average temperature between 1770 and 2009 (included) is 9.6 °C which is 0.4 °C warmer than in Central England, 1659-2009. The standard deviation of the annual mean temperatures from this overall average is 0.98 °C which is 50% higher than 0.65 °C in Central England where the fluctuations are probably lower because of the relative proximity to the "stabilizing" sea (while Prague has a more continental climate).
Let's begin with the 100-year trends (linear regression). I have to emphasize that the y-axis in all the graphs below is the warming trend (a kind of smoothed derivative of the temperature), not the temperature itself.

We see that the trends were positive in the 20th century and negative in the 19th century. The fastest warming and cooling was in
1910-2009: +1.88 °C/century
1789-1888: -1.46 °C/century
For 50-year trends, the graph looks like this:

The fastest warming and cooling was:
1960-2009: +3.93 °C/century
1806-1855: -3.47 °C/century
However, when you look e.g. at 20-year warming trends, when the man-made warming should be really fast in the current era, our generation actually drops out of the race. The graph looks like this:

A 20th century interval only appears on the 8th place in the ranking:
1779-1798, 9.187 °C/century
1782-1801, 8.317 °C/century
1776-1795, 8.103 °C/century
1778-1797, 7.629 °C/century
1783-1802, 7.407 °C/century
1849-1868, 7.292 °C/century
1777-1796, 7.214 °C/century
1984-2003, 7.125 °C/century
1850-1869, 6.984 °C/century
1780-1799, 6.853 °C/century
And by the way, even the fastest warming at the end of the 18th century loses when compared to the fastest 20-year cooling in the 19th century:
1821-1840, -10.05 °C/century
1822-1841, -9.338 °C/century
1823-1842, -8.005 °C/century
1824-1843, -7.259 °C/century
1819-1838, -7.029 °C/century
1825-1844, -6.879 °C/century
1820-1839, -6.586 °C/century
1831-1850, -6.582 °C/century
1826-1845, -6.461 °C/century
1830-1849, -6.331 °C/century
At any rate, you can't see any unexceptional behavior in the late 20th century Prague, either. Moreover, it's likely that if you adjusted the figures for the urban heating, the warming trend would disappear completely or change to a cooling trend.
Is there a global weirding?
An inkspiller at the New York Times has proposed a new replacement for global warming and climate change, namely global weirding. Well, until November 2009, we have seen a lot of it, but of a different type than Thomas Friedman envisioned.
In order to be able to use any weather event as a proof of climate change, which would certainly simplify the life for all the AGW gods and their prophets, he conjectures that the climate variations are increasing. And no doubt, man is to blame. However, already the first step is wrong because there is no increase of the climate variations.

For example, the graph above shows the "typical" (standard deviation, or "Pythagorean average", as I call it) month-month variations calculated from the Prague 1770-2009 monthly anomalies (which I first have to calculate), smoothed over 10-year intervals or so (with a truncated Gaussian-like measure, but let me not go into irrelevant details).
You see that there is actually a vaguely decreasing trend in these variations. The minimum variations were sometime in 1905-1915 - it's the point 1650 (months since the first 10-year period) on the graph above. But the maximum variations occurred around the point 1000 on the x-axis which corresponds to 1865-1875 and similar years (there are two similar peaks over there).
The decrease of the month-on-month temperature variations in the anomalies is pretty large: the maximum is around 2.8 units while the minimum is close to 2.0, which is a 20% decrease - despite the averaging over 100 month-on-month differences or so! The most recent decade is much closer to the minimum (like around 1910) than the maximum. So the temperatures are actually changing somewhat less dramatically these days, which actually can be justified theoretically, too (the pole-tropic differences have decreased, reducing gradients and storminess etc.).
Similar methods to calculate these things actually lead to similar graphs with similarly located maxima and minima (even when I start with the year-on-year jumps, the basic structure looks very similar).
The quantity I drew, being inspired by Mr Friedman, could be interesting to study but global weirding is just not taking place right now. Before Mr Friedman blames SUVs for his global weirding, he should have noticed that only himself, and not the Earth's climate, has actually been a victim of such a recent global weirding. ;-)
Prague's Clementinum, an old Jesuit Convent and the current National and University Library near the Charles Bridge (Google Maps), hosts the world's second oldest continuously working weather station after the Central England dataset (*1659) and, obviously, the oldest one in the Czech Republic. The records go back to 1770 and haven't been interrupted or modified since 1775.
The picture of the building above is not too beautiful by itself but you can take prettier pictures of the Old Town from the Clementinum tower. ;-)
Today, Clementinum is also the warmest weather station in the Czech Republic, exceeding the annual mean temperature of 10 °C, arguably because of urban effects as well as its low elevation of 192 meters. The coldest station in Czechia is on our highest peak Sněžka, elevation 1602 meters, on the Czech-Polish border. Its annual mean temperature is close to the freezing point. The Czech average is around 7 °C.
Click to zoom in or get the Excel file or CSV file (with proper English decimal points, not comma) with the monthly averages since 1770 which began to be recorded during the reign of Maria Theresa of Austria, queen of Bohemia. The Clementinum temperature was mostly cooling between 1800 and 1900 and mostly warming since 1900, by roughly the same amount.
If you allow me to cherry-pick a bit, the Clementinum's annual mean temperature in 1794 was 11.50 °C but 10.88 °C in 2005.
The 1848 revolution in Prague. As recently as in 1850, Prague only had 157,000 inhabitants, which includes the (relatively negligible) villages that joined Prague later - much fewer than the 1.2 million population today. Guess how the urban heat effects have changed since 1800.
The links above present some evidence that this robust old station which, despite the urban effects, shows that there's been no statistically significant warming in Prague since 1800 (and at most 0.5 °C or so in 200 years, and I haven't subtracted any corrections for the intensification of Prague's urban heat island which may be as much as 0.6 °C per century and which would probably revert the 200-year trend to a significant cooling!), has been deliberately censored from the GHCN data in some way, without a known scientific reason, and replaced by some gapped and strangely artificially adjusted data from the Prague International Airport (Ruzyně, a Western suburb of the Czech capital).
The incomplete Prague International Airport data were taken instead of the Clementinum data. Moreover, inside them, a gap in the 1940s was inserted and the temperatures on both sides were "adjusted" to change a cooling trend (blue) to a warming trend (red).
A lot of seemingly problematic stuff to check.
It's plausible that the Clementinum data actually show that there's been no statistically significant warming in all of Central Europe for 200 years.
Warming trends in Prague since 1770
This text is a counterpart of Warming Trends in Central England Since 1659 where I explain the basic issues. The Prague record, the second oldest, is somewhat shorter.
The average temperature between 1770 and 2009 (included) is 9.6 °C which is 0.4 °C warmer than in Central England, 1659-2009. The standard deviation of the annual mean temperatures from this overall average is 0.98 °C which is 50% higher than 0.65 °C in Central England where the fluctuations are probably lower because of the relative proximity to the "stabilizing" sea (while Prague has a more continental climate).
Let's begin with the 100-year trends (linear regression). I have to emphasize that the y-axis in all the graphs below is the warming trend (a kind of smoothed derivative of the temperature), not the temperature itself.
We see that the trends were positive in the 20th century and negative in the 19th century. The fastest warming and cooling was in
1910-2009: +1.88 °C/century
1789-1888: -1.46 °C/century
For 50-year trends, the graph looks like this:
The fastest warming and cooling was:
1960-2009: +3.93 °C/century
1806-1855: -3.47 °C/century
However, when you look e.g. at 20-year warming trends, when the man-made warming should be really fast in the current era, our generation actually drops out of the race. The graph looks like this:
A 20th century interval only appears on the 8th place in the ranking:
1779-1798, 9.187 °C/century
1782-1801, 8.317 °C/century
1776-1795, 8.103 °C/century
1778-1797, 7.629 °C/century
1783-1802, 7.407 °C/century
1849-1868, 7.292 °C/century
1777-1796, 7.214 °C/century
1984-2003, 7.125 °C/century
1850-1869, 6.984 °C/century
1780-1799, 6.853 °C/century
And by the way, even the fastest warming at the end of the 18th century loses when compared to the fastest 20-year cooling in the 19th century:
1821-1840, -10.05 °C/century
1822-1841, -9.338 °C/century
1823-1842, -8.005 °C/century
1824-1843, -7.259 °C/century
1819-1838, -7.029 °C/century
1825-1844, -6.879 °C/century
1820-1839, -6.586 °C/century
1831-1850, -6.582 °C/century
1826-1845, -6.461 °C/century
1830-1849, -6.331 °C/century
At any rate, you can't see any unexceptional behavior in the late 20th century Prague, either. Moreover, it's likely that if you adjusted the figures for the urban heating, the warming trend would disappear completely or change to a cooling trend.
Is there a global weirding?
An inkspiller at the New York Times has proposed a new replacement for global warming and climate change, namely global weirding. Well, until November 2009, we have seen a lot of it, but of a different type than Thomas Friedman envisioned.
In order to be able to use any weather event as a proof of climate change, which would certainly simplify the life for all the AGW gods and their prophets, he conjectures that the climate variations are increasing. And no doubt, man is to blame. However, already the first step is wrong because there is no increase of the climate variations.
For example, the graph above shows the "typical" (standard deviation, or "Pythagorean average", as I call it) month-month variations calculated from the Prague 1770-2009 monthly anomalies (which I first have to calculate), smoothed over 10-year intervals or so (with a truncated Gaussian-like measure, but let me not go into irrelevant details).
You see that there is actually a vaguely decreasing trend in these variations. The minimum variations were sometime in 1905-1915 - it's the point 1650 (months since the first 10-year period) on the graph above. But the maximum variations occurred around the point 1000 on the x-axis which corresponds to 1865-1875 and similar years (there are two similar peaks over there).
The decrease of the month-on-month temperature variations in the anomalies is pretty large: the maximum is around 2.8 units while the minimum is close to 2.0, which is a 20% decrease - despite the averaging over 100 month-on-month differences or so! The most recent decade is much closer to the minimum (like around 1910) than the maximum. So the temperatures are actually changing somewhat less dramatically these days, which actually can be justified theoretically, too (the pole-tropic differences have decreased, reducing gradients and storminess etc.).
Similar methods to calculate these things actually lead to similar graphs with similarly located maxima and minima (even when I start with the year-on-year jumps, the basic structure looks very similar).
The quantity I drew, being inspired by Mr Friedman, could be interesting to study but global weirding is just not taking place right now. Before Mr Friedman blames SUVs for his global weirding, he should have noticed that only himself, and not the Earth's climate, has actually been a victim of such a recent global weirding. ;-)
Climate CzechGate: Prague's Clementinum censored
 Reviewed by DAL
on
February 17, 2010
Rating:
Reviewed by DAL
on
February 17, 2010
Rating:
Reviewed by DAL
on
February 17, 2010
Rating:


No comments: